

How Much Can Macro Data Really Tell Us? - The Battle of Predictive Power
How Much Can Macro Data Really Tell Us? - The Battle of Predictive Power
How Much Does Macro Data Influence Stock Prices?

A warm hello to all new readers! I’m glad you are on board.
New here? I’m Michael and on a mission to make beating the stock market as easy for you as choosing your favorite ice cream. I write an algorithm that does exactly that.
How it all started. The journey so far.
Behind every upswing and downswing on the stock market lies a world of numbers that need to be deciphered.
The challenge is not to get the data - it's to interpret what the majority will do.
Have you ever found yourself staring at macro data, wondering if and how it could predict the next stock market move?
Well, I have good news. You’re not alone. Investors have been scratching their heads over this question for ages. So, like any curious mind with an affinity for numbers, I decided to dive into the data to find some answers.
Where Do You Get the Data?
Lucky for us, a big chunk of macroeconomic data is available at the FRED (Federal Reserve Economic Data) database.
And the best part is, we have a reason to clap. It's for free.
But with mountains of data, what should you focus on?
I have focussed on these six:
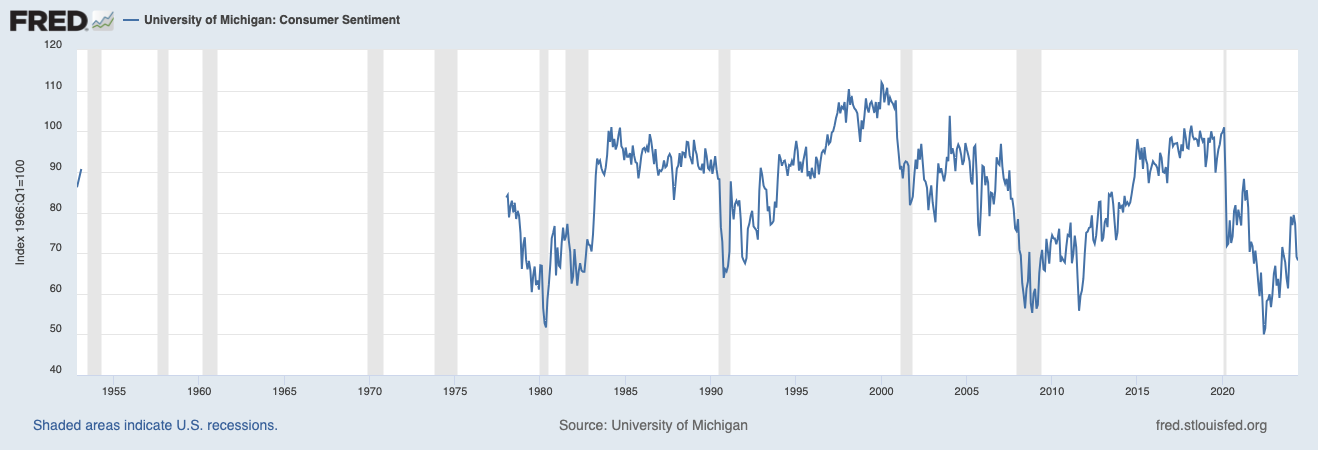
Consumer Sentiment
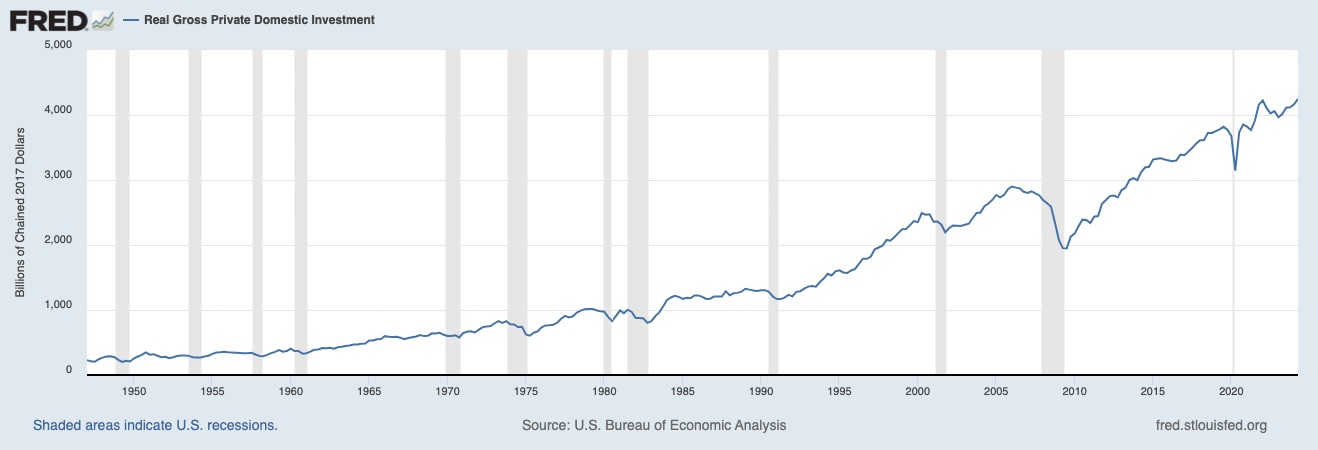
Investment
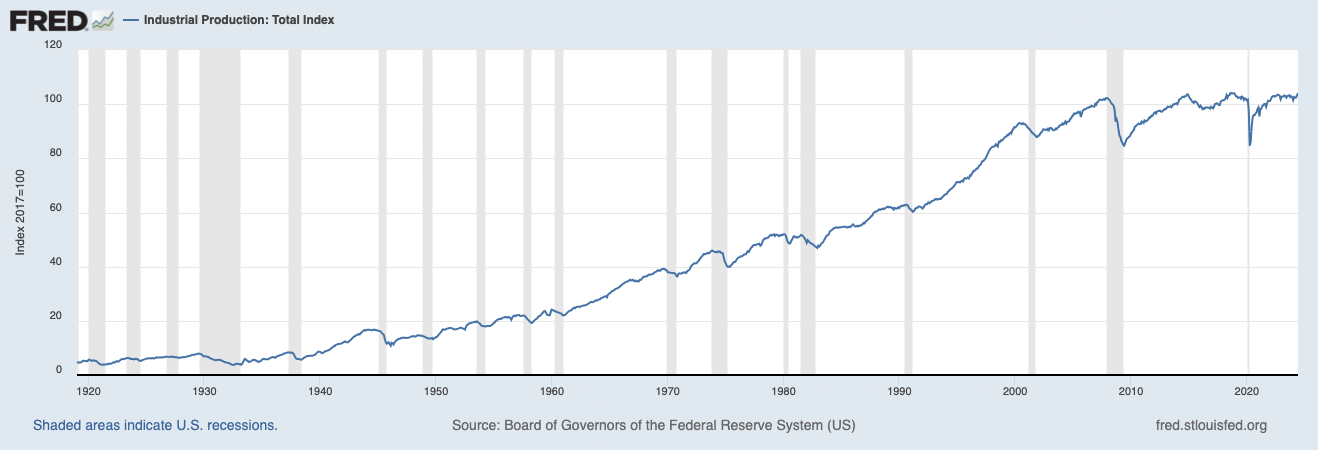
Industrial Production
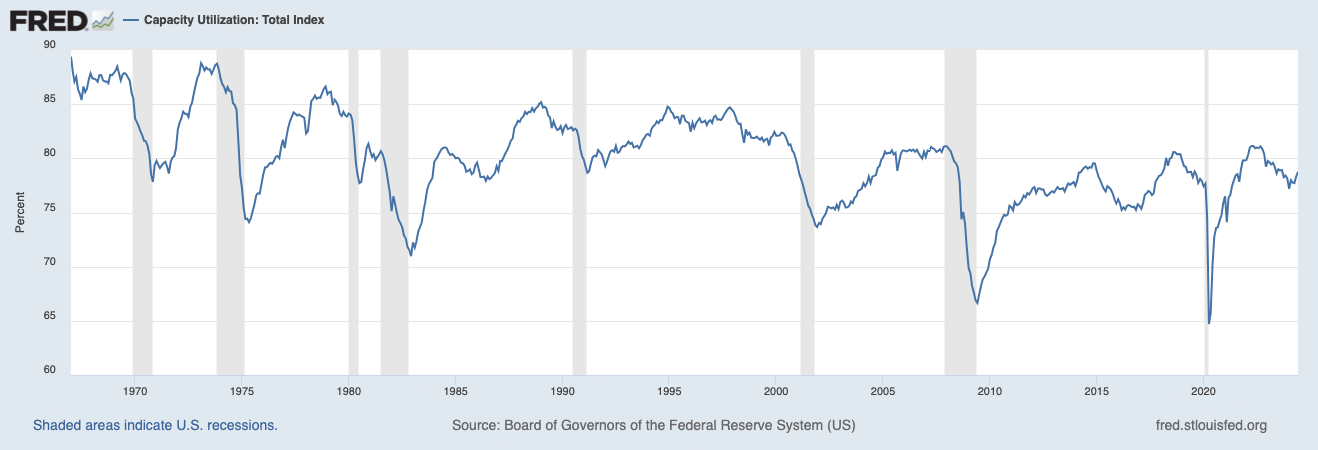
Capacity Utilization
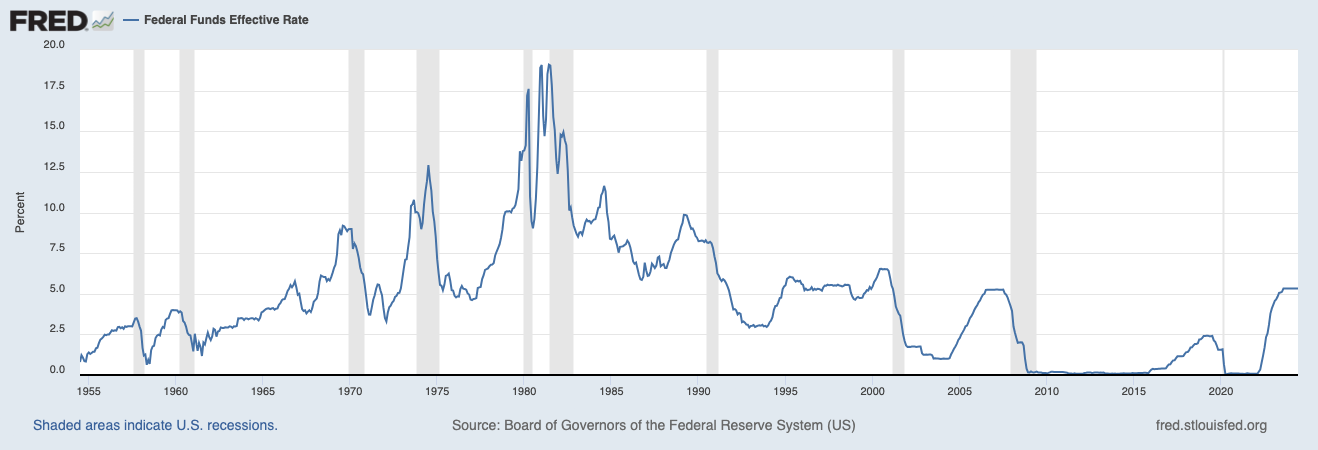
Fed Funds Rate
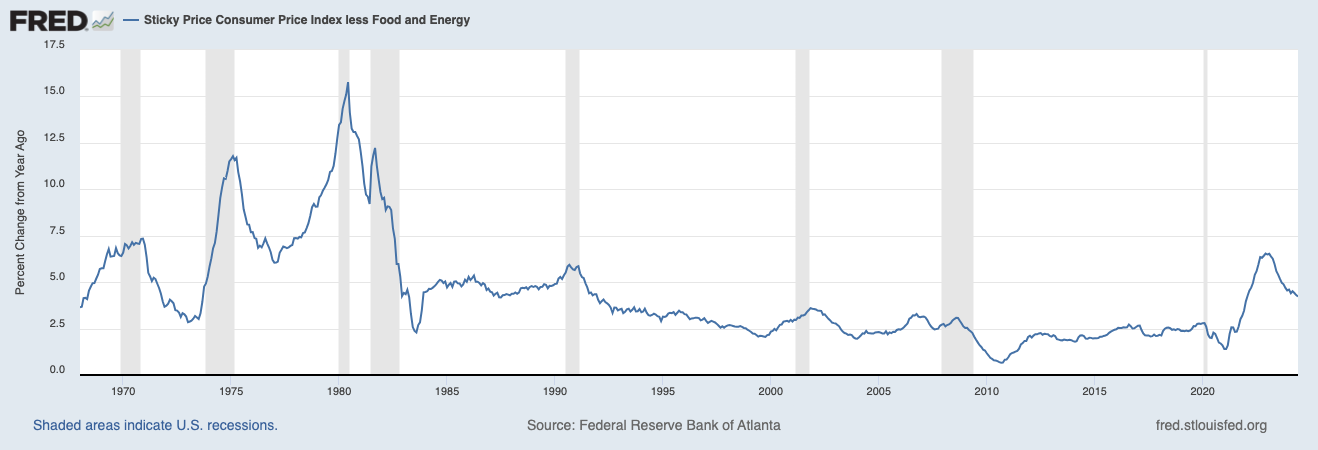
Inflation
Why These Six?
Here is my plain and simplified, straightforward reasoning:
Consumer Sentiment: If consumers are feeling good, they’re likely to spend more, which translates to higher revenues for companies. More money for them, better stock prices for us, right?

Investment: When companies and people invest, it’s usually because they’re hoping for a payout in some sort down the road. It’s the equivalent of planting seeds and hoping for fruits, more money, or more comfort.
Industrial Production: More production equals more sales, which should mean higher company valuations and stock prices. It’s simple math—or at least, it should be, right?
Capacity Utilization: When factories are buzzing at full capacity, companies are usually operating at peak efficiency. More efficiency, more profits, happier investors?

Fed Funds Rate: Cheap money from low interest rates often fuels investment and growth. On the flip side, when borrowed money gets pricey, companies tighten their belts, and stock prices might sag. But is it true?

Inflation: If everything’s getting more expensive, people might start tightening their own belts, buying less, and thus slowing the economy down. Not exactly a recipe for booming stock prices.


Armed with my six trusty indicators, I baked a hypothetical stock universe. The recipe? Companies with a minimum market cap of $1 billion, listed on the NYSE or NASDAQ, and based in the good ol’ U.S. of America. No sector exclusions —I wanted to see the “big picture”.
I also brought the S&P 500 Total Returns in, using it as a yardstick for the overall market performance. To make sense of all this, I performed a regression analysis to see if there were any significant correlations. But before that, I normalized the data, because who doesn’t love a good and clean data set?
Memory Lane goes back to 1995
I crunched the numbers all the way back to 1995, using both operational income and close prices as targets. My goal? To spot a trends or logic that might let me peek into the future and predict whether the market will go up or down.
Did I Find a Crystal Ball?
Let’s just say the results were... enlightening.
Here’s what I found on the operational income side on a high level:
Fed Funds Rate: The correlation coefficient for the Fed Funds Rate is -0.1436. In plain English, this means that as the Fed raises rates, operational income tends to take a hit.
Investment: A positive relationship here, with a coefficient of 0.163 and a p-value of 0.003. So, more investment generally means more money flowing into companies, which is good news.
Overall Fit: The model’s R-squared value came in at a less-than-impressive 0.062. What does that mean? This model explains just 6.2% of the variance in operational income. Adjusted R-squared is even lower, making this a prime example of “could do better.”
So, What’s the Verdict?
If you were hoping for a simple formula to predict the stock market, I hate to burst your bubble. The model does hint that macro data—like the fed funds rate and investment—affects operational incomes, but it’s a small piece of a much larger puzzle.
The other variables? They’re about as significant as a tea-leaf in a tsunami.
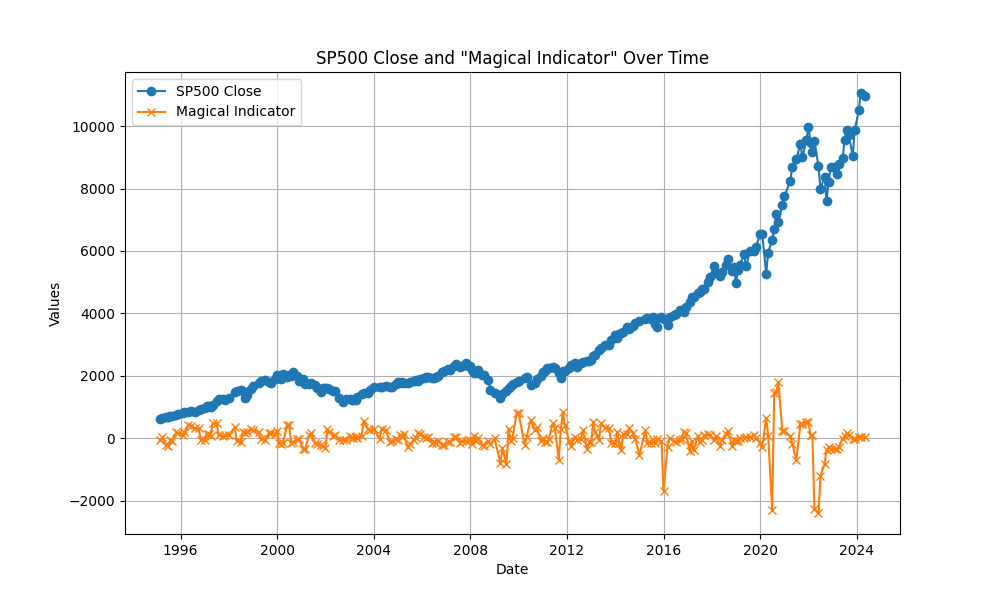
And what about using these indicators to predict S&P 500 returns? Ha! Don’t even think about it. The model managed to predict a whopping 1.9% of the S&P 500’s performance. If that were a grade, it’d be the equivalent of getting almost two question right on a 100-question test—nothing to brag about.
Here is how the mess looks like.
Final Thoughts
This model is like a GPS that only tells you where you are after you’ve already driven off a cliff. Sure, there’s a tiny bit of predictive power, but don’t bet your retirement on it. Macro data can give us some insights, but when it comes to predicting the stock market, I would bet my money rather on fundamental data.
How Can I Improve the Model?
Consider Delayed Reactions: The current model looks at the market's immediate reactions to macro changes. But what if the market takes a bit longer to digest this information? You could try matching the data with market outcomes several months in the future to see if that improves the model's accuracy.
Shorten the Time Window: Another approach is to shorten the time window to analyze. By focusing on short-term changes, you might see if they have a more immediate and noticeable impact on the accuracy.
Should I do that?
Write it down in the comments or vote in the poll.
Which brings me to my last week.

The Progress
This week, I finally finished my day-to-day calculations, and guess what? The model is working well! The idea was to see how the Compound Annual Growth Rate (CAGR) varies over the years. And—surprise, surprise—it does vary, but not as wildly as I expected. Since the model was optimized for just one specific date and set of settings, this wasn’t a shocker at all. But here's the good part: even with this single set, the algorithm outperforms the S&P 500 in terms of total CAGR over 26 years in 247 out of 252 cases e.g. in 98%. This means that the S&P 500 has only beaten us five times – at least so far. Take that, Wall Street!
We have a lot more to offer.
The beauty of my algorithm is its flexibility. I can adjust the date regions and fundamental settings I want to optimize.
Why is that important?
Sometimes the market is literally " out of stock" in terms of the stocks we are interested in. Right now, the algorithm says: “Nope, under these circumstances I don’t invest, period.” Which leads, at least right now, to a none investment year, hence the performance drop. The money is kinda idling our bank account. But we can still look for the best possible alternative stocks the market has to offer. So, under these circumstances, the algorithm will switch to different settings and we can further invest our money.
Of course, this optimization will take some time, but I am confident that I will release a bigger update in the coming weeks, as this is only limited by the processing power. I’ve started the optimization process, and the results are already satisfying, which proofs the math is working.
Now, let's be real: as much as I love to share this, we're always talking about past results here, and we all know that past performance doesn’t guarantee future outcomes. But hey, if statistics didn't work, they wouldn't still be around, right? Our focus is on the long-term, meaning sticking to the strategy for at least five years. And in that timeframe, statistical patterns have a way of playing out because history has this funny habit of - repeating itself.
By the way, every investment strategy is based on some sort of past pattern—how else would we do it?
The great thing about this algorithm is that it can adjust to changing market conditions. The goal is to be as realistic as possible. That’s really all we need, and frankly, all I care about.
What Do I Mean by Changing Market Conditions?
Stock markets tend to move in patterns—think of them as waves at the beach. These waves have been widely studied, and when you can spot them, you can adjust your strategy accordingly, up to a certain point.
Some of the “most famous” patterns are:
The January Effect: This is when stock prices tend to rise in January. It’s often attributed to tax-loss harvesting at the end of the year, followed by reinvesting in January, or just the general optimism that comes with a fresh start.
Sell in May and Go Away: This old saying suggests that the stock market performs better from November to April and tends to underperform from May to October. This pattern is linked to psychology, economic cycles, and the summer lull when trading volumes drop as everyone heads off on its well-deserved vacation.
Window Dressing aka Santa Claus Rally: No, Santa doesn’t literally bring you stock gains, but there is a tendency for the market to rise in the last week of December and the first two trading days of January. This could be due to holiday cheer, low trading volumes, and institutional investors positioning themselves for the new year.
October Effect: October gets a bad rap because of infamous market crashes like the 1929 crash and the 1987 Black Monday. Maybe it’s just a bit of bad PR, but we are often irrational.
September Slump: Now, September is the real culprit, historically being often the worst month for stocks. The reasons are murky, but it might have to do with summer ending, and institutional investors rebalancing their portfolios.
With these patterns in mind and the above, it makes sense to me what the algorithm is doing.
So to help it, I’ll create a map for the algorithm to navigate these waves as smoothly as possible.
The Plan
While the code is doing its work without me babysitting it, I can again dive deeper into my search for red flags and value traps. I’ve found some promising indications, but as always, I need to put them through the wringer first. And if they perform as well as the last ones, I won’t get too excited until we see some results.
What’s on my mind
Yesterday I got a text message.
It was from a guy with the same type of cancer as my mom. We had a very long phone call in May and I was happy to hear from him.
This message is so inspiring because it’s full of pure, unfiltered truth.
Illness is the expression of the body urging the spirit to develop. You are suffering at some stage of your life and holding on to it out of ignorance. Something you should grow beyond. It serves your mental development!
Once resolved, you will gain an inner maturity that will redefine and reorganize your life.
You will perceive life for what it really is.
A passing item.
But this only happens when you have resolved the resistance within you and you no longer act out of fear. You will only realize that you are acting out of fear once you have recognized and resolved it!
We can usually never see and recognize our most powerful fear well enough because they absorb us almost completely. They disguise themselves as something completely normal...
The strongest trigger potentials come from the identification with your ego. The ego reacts with such a powerful force that we, as observers, are completely torn out of the observer’s perspective and are fully in the grip of our emotions.
We don’t seem to be able to take any clear memories with us from these trigger moments (for the time being). Even though they seem so extraordinary in our everyday lives.
It is precisely these currently disturbing, omnipresent circumstances that need to be recognized, understood and accepted with our body and soul.
Intellectual understanding alone is not enough!
The good thing is that anyone can do it. Nobody is privileged in this regard.
Everyone can do it equally well with the same potential!
You will feel it immediately when you have solved your biggest problem.
Then you will know that everything is OK!
Nuggets
The message is a big chunk to chew on and I hope it leads you in the same direction as it did me. To appreciate life and make the most of it. I think that's the point of life - to give it meaning.
Hit that heart if you love life!
Michael
Recommend The Economy Rocket to your readers and friends
I share my stock investment story without sugarcoating – you get the good, the bad, and those tricky ego trips. I'm developing a service with a mix of smart code and proven investment strategies, making stock analysis a thing of the past if you wish. Why? Because life offers so much more beyond the confines of stock analysis.

Disclaimer:
The information in this article is my personal opinion. I’m not a certified investment professional. It is not consulting, nor does it constitute investment recommendations.
I do my research carefully and follow my personal investment strategy.
The stock market is a complex building with its own rules. There are no rules set in stone, like the rules of physics.
Therefore, use the contents of this newsletter at your own risk and do your own research as well. Investing in the stock market can lead to a total loss of the capital invested.
Thanks for highlighting those important macro data! My first investment management manager told me that economic growth does not predict / equal market performance so a lot of times understanding the (intrinsic) valuation, fundamental data like ROE trend, and changes in market structure and megatrends as well as the macro policies are important.